Ameya360:TrendForce Forecasts 4% <span style='color:red'>YoY</span> Drop in Foundry Revenue This Year
  As demand continues to slide for all types of mature and advanced nodes, major IC design houses have cut wafer input for the first quarter of 2023 (1Q 2023) and will likely scale back further for 2Q 2023, according to TrendForce’s recent analysis of the foundry market.  Currently, foundries are expected to maintain a lower-than-ideal level of capacity utilization rate in the first two quarters of this year. Some nodes could experience a steeper demand drop in 2Q 2023 as there are still no signs of a significant rebound in wafer orders. Looking ahead to the second half of this year, orders will likely pick up for some components that underwent an inventory correction at an earlier time. However, the state of the global economy will remain the largest variable that affect demand, and the recovery of individual foundries’ capacity utilization rates will not occur as quickly as expected.  Taking these factors into account, TrendForce currently forecasts that global foundry revenue will drop by around 4% year-on-year (YoY) for 2023. The projected decline for 2023 is more severe when compared with the one that was recorded for 2019.  TrendForce also points out that the latest geopolitical risks have led to a geographical realignment across the supply chain. In the case of IC design houses, they are preparing to lower the share of chip production based in China, and the effect of this reallocation of foundry orders will be increasingly noticeable in 2H 2023 and become quite obvious by 2024. The supply and demand conditions of the foundry market will gradually become regionalized as well. This, in turn, will cause divergences among foundries with respect to capacity utilization. Hence, the recovery of the whole foundry industry’s capacity utilization will be influenced by not only seasonal patterns and clients’ inventory levels but also geographical distribution of orders within the supply chain. This last factor warrants greater attention as well.  Now, entering 1Q 2023, sales of consumer electronics including smartphones, notebook (laptop) computers, and TVs are in a slump because of the traditional low season. Moreover, the sluggish pace of inventory consumption will affect foundry orders from IC design houses for components such as consumer-grade PMICs and MOSFETs, to name a few. Due to these developments, 8-inch wafer foundries still suffer an ongoing decline in capacity utilization rate. On the other hand, the 8-inch wafer orders for 2Q 2023 show a slight demand rebound. This is mainly attributed to some orders involving special industrial computers and a few clients adjusting order allocation among foundry partners. Nevertheless, the contribution from these sources of demand to the utilization of the overall 8-inch wafer foundry capacity is limited. TrendForce’s latest investigation indicates that 8-inch wafer foundries’ capacity utilization rates will remain mostly constant between 1Q 2023 and 2Q 2023. For now, TrendForce does not believe a substantial recovery will occur in the near future.  Turning to 12-inch wafer foundries operating with the advanced nodes, TSMC is expected to keep a lower-than-ideal level of capacity utilization rate in 1H 2023. Then, TSMC should be able to raise the rate of its 7nm node in 2H 2023, though the increase will still be limited. As for TSMC’s 5nm node, its rate will eventually return to the optimal level in 2H 2023 thanks to stock-up activities related to the releases of new devices during the traditional peak season. Looking at Samsung, capacity utilization rate will stay low for its ≤8nm nodes through 2023 chiefly because its main clients Qualcomm and NVIDIA have opted to reallocate orders to other foundries.  Regarding 12-inch wafer foundries operating with the mature nodes, they will mostly retain a capacity utilization rate of 75~85% in 1H 2023. These foundries, which include TSMC, UMC, and GlobalFoundries, are actively expanding into application segments that offer a more stable level of demand. Examples include automotive electronics, industrial equipment, and medical devices. Thus, the mature nodes are able to maintain a relatively high capacity utilization rate. TrendForce has also observed that the 28nm node has a higher rate compared with the 55/40nm nodes. Furthermore, foundries that have a higher proportion of consumer-grade chips in the product mix have experienced a larger rate drop. Their rates have mostly dipped to around 65~75%.  In 2H 2023, significant geopolitical risks will likely persist. Furthermore, some major OEMs have initiated a review of supply partners so that they can meet the requirements of the tenders released by the US government. Therefore, they are going to continue with their efforts to relocate their supply chains. Also, IC design houses have successively moved portions of their orders to foundries based outside China. Most of these reallocated orders are for 8-inch wafer foundry. Therefore, non-Chinese foundries such as UMC and Vanguard will likely see a slightly above-average hike in the utilization rate of 8-inch wafer foundry capacity during the second half of the year.  The market for end products as a whole has gone through about a year of inventory corrections. Therefore, the momentum of stock-up activities will get stronger for certain consumer-grade chips later in 2023 as OEMs prepares for the traditional peak season. TrendForce says some urgent orders and a few other orders involving products with special specifications will arrive and slightly boost foundry demand in 2Q 2023. Then, starting in 3Q 2023, capacity utilization rate will climb more noticeably in both the 8- and 12-inch wafer segments. However, this rise in foundries’ capacity utilization rates could be constrained by the uncertain economic outlook. Thus, foundries are not expected to return to the fully-loaded status within the short term.  More than 20 new wafer fabs to be built  In the medium to long term, the foundry market will become more fragmented because the building and diversification of production capacity will take place across different regions. TrendForce’s research finds that plans for a total of more than 20 new wafer fabs have been initiated in recent years. Regarding the geographical distribution of these new fabs, Taiwan will have five, the US will have five, China will have six, Europe will have four, and another four will be located among South Korea, Japan, and Singapore.  Governments worldwide are now much more aware of the importance of local manufacturing due to recent geopolitical events, and semiconductor chips have gradually emerged as a strategic resource. Therefore, apart from commercial interests and cost structure, foundries now have to give a greater consideration to certain countries’ subsidy policies and their clients’ need for local content. At the same time, they will still need to maintain a healthy supply-demand balance for the whole market. TrendForce believes a diverse range of offerings and an effective pricing strategy are the key factors that will enable foundries to maintain a successful operation in the future.
Key word:
Release time:2023-01-20 13:25 reading:1923 Continue reading>>
Global Handset ASP Increase Limits 3Q 2022 Revenue Decline to 3% <span style='color:red'>YoY</span>
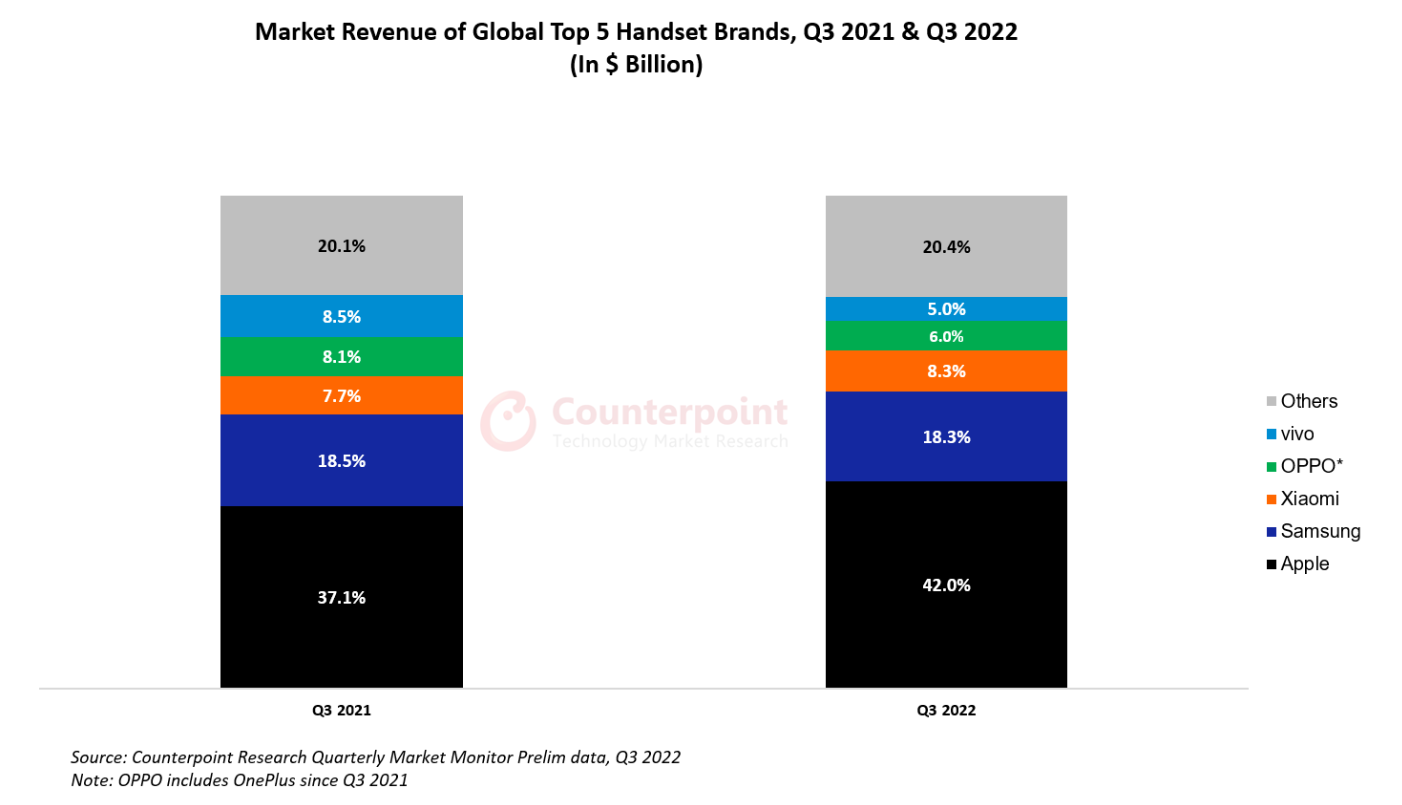
  The record shipment contribution (46%) of 5G handsets, which cost five times an average non-5G handset, added to the global smartphone ASP and revenue growth.  The global smartphone handset market’s revenue declined by 3% year-on-year (YoY) in the third quarter (3Q 2022) to just above $100 billion, according to the latest research from Counterpoint Technology Market Research’s Market Monitor Service. A 10% YoY growth was seen in the average selling price (ASP) thanks to the premium handset segment’s greater resilience to economic uncertainty.  The record shipment contribution (46%) of 5G handsets, which cost five times an average non-5G handset, also added to the ASP and revenue growth. In terms of shipments, the overall handset market saw a 12% YoY decline during the quarter.  “At over $80 billion, the revenue contribution of 5G handsets reached an all-time high of 80% of global handset revenues, up from 69% in the third quarter of last year. In the same period, LTE handsets’ revenue contribution fell 10% to $19 billion. This shift from 4G to 5G has been led by Apple, which alone makes up for over half of all 5G revenues as over 95% of its phones are 5G-enabled. Apple saw a 10% YoY revenue growth and 7% YoY ASP growth in Q3 2022, contributing to an overall increase in global handset ASP. This is thanks in part to the launch of the iPhone 14 series as well as the Pro models, especially from the previous generation, doing well,” Senior Analyst Harmeet Singh Walia said.  Samsung, the second biggest handset OEM in terms of revenue, saw a relatively modest ASP increase of 2% YoY in Q3 2022 despite an almost doubling of the shipments of its premium Flip and Fold series in the same period as well as a 27% YoY revenue growth of its 5G smartphones. The lower growth of its ASP can be attributed to a shift in its focus from the more successful S22 series to the still upcoming foldable series. Consequently, Samsung’s revenue declined 4% YoY in Q3 2022.  Xiaomi’s handset revenue grew 4% YoY, a significant portion of which came from the low-to-mid price bands. The shipment share of the over-$300 price band declined by close to 1.5%. There was, however, a significant shift from the sub-$200 to $200-$299 price band. Consequently, Xiaomi’s ASP grew 14% YoY to $205.  OPPO, on the other hand, saw an ASP as well as a revenue decline of 5% and 27% YoY respectively. The revenue decline was primarily caused by OPPO’s shipment decline in COVID-hit China, which contributed over 40% to its total shipments in Q3 2022. Given that China contributed over half of vivo’s total shipments, its revenue took an even bigger hit of 43% YoY despite growing 4% QoQ.
Key word:
Release time:2022-12-30 16:33 reading:2505 Continue reading>>
NAND Flash Manufacturers to Cut Capex by 2% <span style='color:red'>YoY</span> in 2019 Due to Worsening Oversupply
Experiencing an oversupply over the entire year of 2018, the global NAND Flash market continues to face excess capacity this year as the demand outlook for notebooks, smartphones, servers and other end products remains weak, reports DRAMeXchange, a division of TrendForce. NAND Flash manufacturers have slowed down the capacity expansion by cutting capex in 2019, aiming to moderate the oversupply by limiting the bit output growth.South Korean manufacturers have taken initiatives to cut their NAND Flash capex due to the worsening oversupply in 2018, says DRAMeXchange. Even though the total capex in the whole NAND Flash industry has been cut by nearly 10%, the oversupply has continued. Looking ahead to 2019, U.S.-based manufacturers would also lower their semiconductor capex, and the total capex in the global NAND Flash industry is expected to be $22 billion, about 2% YoY lower than in 2018.Influenced by the adjustments in capacity expansion, 92/96-layer 3D NAND products would only account for about 32% of the industry’s total output by the end of 2019, while the portion of 64/72-layer products remains over 50%, although the major manufacturers have entered the mass production of 92/96-layer 3D NAND since the fourth quarter of 2018. As the manufacturers slow down capacity expansion and migration to advanced process, the bit output growth of NAND Flash is expected to be around 38% in 2019, significantly lower than over 45% in 2018.As for the capacity adjustments of manufacturers, DRAMeXchange notes that Samsung’s NAND Flash bit output growth is expected to be around 35%, considering the following two factors. First, Samsung would continue to reduce its production capacity for 2D NAND. Second, the operating capacity would also decrease compared with the end of 2018, since the 92-layer process requires more space in the fab. The slowdown in bit output growth would have great impacts on the global NAND Flash production, because Samsung's share in the NAND Flash market is about 30%.SK Hynix and Toshiba/Western Digital also have a chance to see smaller bit output growth. The two companies have respectively new M15 fab and Fab 6, but would also be affected by the production reduction plan or capacity transfer to previous-generation process. Therefore, DRAMeXchange has revised the forecast of their annual bit output growth to less than 50% and 35%, down from previous forecast of 50% and 40%, considering the weak demand outlook.Micron's new fab in Singapore will not officially enter mass production until 2020, so the company’s wafer capacity per month in 2019 will remain flat when compared to 4Q18. Intel plans to reach a full load capacity in its Dalian fab, but does not have other capacity expansion plan. The joint bit output of Micron and Intel would grow by nearly 40% in 2019, noticeably lower than 45% in 2018.In terms of the NAND Flash price trends for 2019, the quotes for various product lines would witness apparently steeper drop than DRAMeXchange’s previous forecasts, indicating the excess inventories faced by manufacturers. DRAMeXchange expects a quarterly decline of 20% in 1Q19, higher than previous forecast of 10%, and a further decline of nearly 15% QoQ in 2Q19. For 2H19, the price decline may be slightly moderated considering the coming of peak season, but prices would continue to fall by around 10% each quarter. It remains to be seen whether manufacturers are able to further limit their bit output growth. In sum, the average NAND Flash price would decrease by nearly a half in 2019, according to the calculation of DRAMeXchange.
Key word:
Release time:2019-01-11 00:00 reading:1179 Continue reading>>
Total Consumption of Driver IC Grew by 8.4% <span style='color:red'>YoY</span> in 2018, but Growth Would Slow Down to 3% in 2019
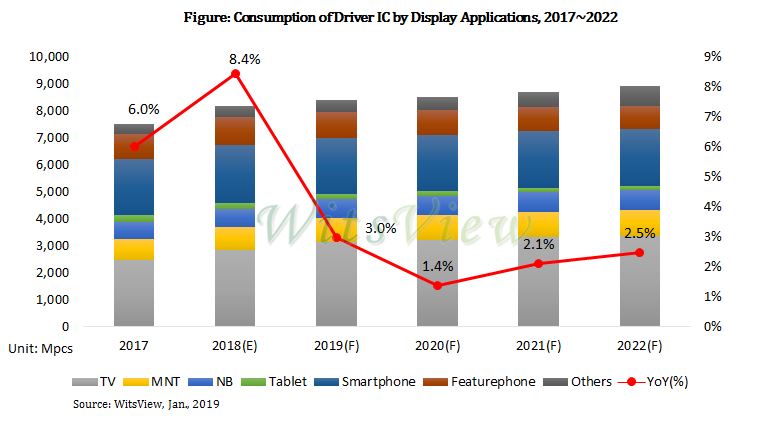
According to the latest report by WitsView, a division of TrendForce, increasing penetration of UHD display panels has driven the consumption of driver IC in the past few years. The total consumption grew by 8.4% YoY in 2018, but the growth would slow down to 3% this year due to technology variation in designs of large-size panels and falling shipments of small-size panels.As for the breakdown of driver IC consumption by types of application, TV panels would consume around 35% of all the driver ICs, remaining the major growth momentum in 2019, says Julian Lee, the assistant research manager of WitsView. However, with growing demand for narrow-border products and wider adoption of the Gate on Array technology in new devices, growth in the consumption of driver ICs by large-size panels would be moderated this year. In the segment of small-size panel, the consumption of driver ICs would drop due to weak sales in the global smartphone market and the decrease in tablet market size. Overall speaking, growth in the driver IC market would slow down compared with past few years, before momentum appears again after 2021, when electronic devices anticipate a new wave of specs upgrade due to higher transmission speed in the maturing 5G network. By then, the next wave of replacement demand for smartphones, higher penetration of 8K TV, and the emergence of new applications like Internet of Vehicle and IoT would again trigger growth in the driver IC market.Film for Chip-on-Film packaging would see undersupply in 2019As 18:9 becomes the mainstream aspect ratio for new generation smartphones, phone makers have been working to make bezels narrower. Therefore, smartphones, such as the three new iPhones launched last year, have been switching from solutions based on Chip-on-Glass (COG) packaging to those on Chip-on-Film (COF) packaging. On the other hand, new production capacity of large-size panels in China has pushed up the shipments of TV panels, increasing the demand for films used in COF packaging as well. However, in the past few years, makers of the film for COF packaging have not invested new capacity due to weak profitability, so the recent demand increase may result in a tight supply of films.WitsView notes that TVs and LCD monitors also use COF packaging, but the profits are lower than COF packaging for smartphones. Since the number of smartphones using COF packaging is highly likely to double in 2019, the supply of film for TVs and LCD monitors may be squeezed. The global shipments of panel would also be influenced as films in COF packaging for large-size panels may see undersupply in 1H19.
Key word:
Release time:2019-01-08 00:00 reading:1276 Continue reading>>
Shipments of Large-Size Panels to Grow by 1% <span style='color:red'>YoY</span> in 2019 Driven by Specs Improvement
According to the latest report by WitsView, a division of TrendForce, shipments of large-size panels reached 804.06 million pieces in 2018, a YoY growth of 2.5%. Among all the large-size display panel applications, only tablet panel recorded decreasing shipments last year, while other categories registered noticeable growth. The segment of TV panel was driven by new production capacity in the industry and special deal projects, while the LCD monitor segment grew due to the increased production volume of borderless monitors and momentum from global sports events. As for notebook panels, notebook manufacturers started their stock-ups earlier than previous years, in fear of the shortage of components like driver ICs. As a result, the notebook panel shipments for 2018 increased as well.“Looking ahead to 2019, shipments of large-size panels are expected to reach 811.77 million pieces, an annual grow of 1%, driven by specs upgrades”, says Iris Hu, the research manager of WitsView. Shipments of notebook panels are expected to grow by 1.6% YoY to reach 190.12 million pieces, as high resolution and narrow-border models will still be popular in the market. The growth of borderless models and the gaming market will bring more replacement demand for peripherals, pushing monitor shipments to a new high of 158.03 million pieces, a YoY growth of 4.4%. In addition, three new fabs will enter the operation this year, with a focus on producing large-size TV panels. Thus, TV panel shipments are expected to reach 285.98 million, an annual growth of 1%. This will mark the third consecutive years for TV panel shipments to grow.As for the specs of TV panels, panel makers have been making UHD a standard feature for large-size TV panel products and narrowing the price gap between and UHD and FHD products in recent years, boosting the penetration rate of UHD models to 39% in 2018. Looking ahead to 2019, two gen 10.5 fabs will focus on producing 65-inch and 75-inch panels, while gen 8.5 fab will shift to production of 55-inch ones in order to consume the capacity. Meanwhile, the production volume of 32-inch panels will be cut. The adjustments in product mixes would drive the penetration rate of UHD models up to 50%. Particularly, most of 55-inch or larger products will feature UHD. For 50-inch models, the penetration rate of UHD models has reached 88% this year after the gen 8.6 fab adopted economic cut. In 2019, the rate will continue to grow and 96% of 50-inch TV panels would feature UHD if the capacity expansion is completed.IT panel makers will continue to focus on reducing border size. Both borderless PC monitor panels and narrow-border notebook panels recorded impressive shipments in 2018. With panel makers’ active capacity expansion for borderless PC monitor panels and promotion of PC brands, the penetration rate of borderless panels reached 31% in 2018, and has a chance to reach 45% this year as the demand continues to increase and capacity to expand.As for notebook panels, the market not only focuses on increasing viewing angle and resolution, but also tries to increase the screen to body ratio inspired by the trends in the smartphone market. Notebook panel makers have been tried to place 14-inch narrow border panels in 13.3-inch case, making the products thinner and lighter, together with a new selling point. This trend drove the shipments of narrow-border notebook panels to increase by 347% in 2018, and the penetration rate to 25%, 19 percentage points higher than in 2017. As the price gap between narrow border models and panels with VESA standard gradually reduces, the penetration rate of the narrow border panels will exceed 40% in 2019.
Key word:
Release time:2019-01-04 00:00 reading:1079 Continue reading>>
Global Server Shipments to Grow by 5% <span style='color:red'>YoY</span> in 2018, but Growth May Slow Down in 1H19
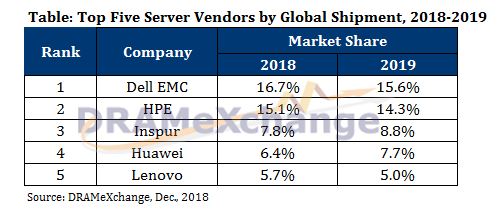
According to the latest report by DRAMeXchange, a division of TrendForce, the global server market has continued to grow in 2018, with the total shipments estimated to reach 12.42 million units, a YoY growth of around 5%. Dell EMC, HPE (including H3C), and Inspur will be the top three server suppliers with the shipment market shares of 16.7%, 15.1%, and 7.8% respectively.According to Mark Liu, senior analyst at DRAMeXchange, the growth of global server market is mainly driven by branded server suppliers in North America, who contribute to more than 30% of the global server shipments. As for the percentage breakdown by types of server, enterprise servers account for the majority of the global shipments while the percentage of servers used for Internet data center grows to nearly 35%. The continued growth is because demand from Internet data centers is less seasonal. The YoY growth rate of the ODM direct business in North America reached 17% in 1H18 and is forecasted at 12% in 2H18. The growth is moderated in the second half of the year due to adjustments in stocking and slowdown in CAPEX.Over the past year, brands experienced a noticeable recovery in 2Q18 with more than 10% QoQ growth in global server shipments, after a slight decline in 1Q18 due to seasonal headwinds. In 3Q18, the shipments peaked at 3.2 million units. Looking ahead to 2019, the shipment growth is expected to slow down to 2% in the first half of the year, as the stock-ups for migration to the latest processor platform began earlier than expected and have approached the end by 2018, so brands tend to be conservative about new market deployment. In the second half, the market may have new demand momentum after new platforms like Gen2 from Intel and Rome from AMD come out.North American server brands would register strong performances driven by cloud computing and commercial server marketIn the ranking of global server shipments, North American companies still occupy the top places with outstanding performances. Dell EMC and HPE, which take the first and second places respectively, still dominate the market of commercial servers. It is worth mentioning that, with the emergence of cloud computing, Dell EMC has taken a place in the global cloud infrastructure market, with a share of 10%. The company will continue to increase the share of storage servers in its product mixes.However, HPE, which is more profit-oriented, has stopped selling servers for low-gross-profit hyperscale server infrastructure. Instead, it has turned to enterprise integration and hyper-coverage solutions to increase revenue.Inspur ships nearly one million servers, Huawei increases its server shipments by 20%Inspur's global shipments have risen significantly to nearly 1 million units, with almost 30% of which shipped to the Chinese market. This is because the government has been encouraging Chinese companies to adopt servers made by domestic brands, together with increasing orders form data centers. A majority of Inspur’s ODM business and server orders comes from internet companies in China, especially tier-1 companies like Baidu, Alibaba and Tencent. Together with orders from tier-2 companies like Toutiao, Meituan, Didi, and JD, Inspur still has orders coming in during the second half of this year. DRAMeXchange expects that Inspur’s strategic plan for the next year will focus on developing new customers, especially those in North America.Huawei registered a record YoY growth of 20% in shipments due to stable orders from telecom operators. Around 70% of the servers shipped by Huawei are sold to the Chinese market, and the rest are sold to European carmakers and telecom operators’ server (5G and telecom server) and data center construction.
Key word:
Release time:2018-12-21 00:00 reading:1169 Continue reading>>
Global Shipments of Smart Speakers to Grow by 53% <span style='color:red'>YoY</span>, Reaching 95.25 Million Units in 2019
TrendForce has published a new report profiling the latest trends in the global smart speaker market. According to data in the report, the global shipments of smart speakers are expected to reach 62.25 million units in 2018. Driven by the expansion of Google Home into more regions and the growth of smart speaker market in China, the shipments would increase further by 53% YoY, reaching 95.25 million units in 2019. With the strongest growth momentum among all categories of consumer electronics, smart speakers have emerged as a major application of voice interactions and are fast becoming the gateway to other smart-home products as well as the vast ecosystems. Companies including Apple, Facebook, Baidu, and Tencent have all entered the market this year, in addition to first movers.“Currently, Amazon accounts for around 70% of the US market, therefore Google has to turn to explore the overseas markets”, says TrendForce analyst Tom Tien. With outstanding AI speech recognition, Google is actively developing the voice-user interface for multiple languages, with Google Home supporting 6 languages since 2018, an improvement from 4 languages in 2017. Google Home is now available in 13 countries, up from 6 last year. For 2019, it is expected to be available in more than 18 countries and to support more than 11 languages as well, driving its 2019 global shipment to 30.96 million units, a YoY growth of 72%.Chinese market anticipates a reshuffle and will experience a period of rapid growth in 2019As for the Chinese market, China anticipates fast-growth of smart speakers in 2019, but may go through low price competitions before that, says Tien. The aggressive prices offered by major companies may eliminate smaller smart speaker brands out of the market.In the upcoming online shopping event in China on November 11th, major smart speaker brands tend to offer more competitive prices to expand their market shares. For example, Alibaba’s smart speaker, Tmall Genie series, and Baidu’s Xiaodu speaker are available at lower prices in this month. Tmall Genie Fang Tang has an original price tag of RMB199, and is available at RMB149 for pre-orders from October 20th to November 10th, and down to RMB69 on November 11th. For Tmall Genie X1, the original price tag and the pre-order prices are RMB499 and RMB239 respectively. The price of Xiaodu speaker will decrease from RMB249 to RMB79.The aggressive prices offered by these leading companies will make other smaller brands less competitive, and thus withdraw from the market or transfer to niche market due to the cost pressure and loss. We anticipate that the Chinese market will experience a reshuffle and enter a period of rapid growth in 2019, when the customers shrug off their conservative attitudes and become more positive about smart speakers.TrendForce forecasts that Chinese smart speaker brands would reach shipments of 28.71 million units in 2019, a significant YoY growth of 101.2% from 14.27 million units in 2018.In terms of market strategies, the major Chinese smart speaker brands not only offer competitive deals but also appeal to customers by showcasing their respective advantages. For instance, Alibaba focuses on AI applications, Xiaomi emphasizes on building its hardware ecosystem; Baidu, on the other hand, is ramping up in both AI and ecosystem investments to catch up with its rivals. For the coming years, the major brands share a common goal to build their AI speech recognition systems and comprehensive ecosystems of hardware, services, and application to lock users in. Therefore, we expect to see a boost in demand for smart speakers in China soon.As for international brands, smart speakers produced by Amazon, Apple, and Google are all unavailable in China. Due to the lack of access to the Chinese language in their products, it is difficult to expand their services in China.
Key word:
Release time:2018-11-08 00:00 reading:1084 Continue reading>>
LCD Monitor Shipments to See 1.5% <span style='color:red'>YoY</span> Growth in 2018 After Seven Years of Decline
The shipments of LCD monitor are projected to reach 126 million units in 2018, a YoY growth of 1.5%, after seven years of decline, according to WitsView, a division of TrendForce. The main drivers of shipment growth include the falling panel prices and rising demand from North America. The strong sales in niche segments like gaming and borderless monitor also offer growth momentum.North American market records strong demand, with Dell and HP taking the lead in monitor shipmentsThe LCD monitor panel prices have been falling since April 2017, says Anita Wang, senior research manager of WitsView. With the panels approaching a mid to low price level, the branded monitor vendors have enhanced their profitability across their product ranges, and will continue to increase their shipment volumes. Particularly, benefited from the expansion in gaming segment, acer is expected to increase its monitor shipment by 15.2% YoY in 2018, the highest growth rate among the brands. In the global ranking of monitor shipments, acer will remain the 7th.The strong economic performance in North America has boosted both consumer and commercial demand. Hence, Dell, HP, and ViewSonic are expected to record remarkable shipments, with the annual growth rates of 7.5%, 10.6%, and 9.2% respectively. Dell would also achieve a new record market share of 19.6%. HP would surpass AOC/Philips to take the second place in the shipment ranking, with a market share of 13.8%.In addition, LGE would outperform Samsung, who dropped to the sixth in the ranking. Samsung witnesses a decrease in shipment because it has allocated more capacity to products with higher profits and thus shipped fewer monitors smaller than 21.5 inch.“Borderless monitors also offer growth momentum to the shipments this year,” says Wang. In addition to a modern look, borderless monitors suit large-size products and provide more comfortable viewing. Brands like Dell, HP, and Lenovo have taken initiatives to adopt borderless design in IPS products. For 23.8-inch panels, the price gap between bordered ones and borderless ones has been largely narrowed this year, driving the penetration rate of borderless LCD monitors in the global monitor market to 30~35% in 2018 and to about 50% in the next two years (2019~2020).
Key word:
Release time:2018-10-09 00:00 reading:1283 Continue reading>>
Shipments of Sensing Camera in Automotive OE Market Will Grow by 63% <span style='color:red'>YoY</span>
According to the latest research by TrendForce, the demand for sensing camera in automotive OE (Original Equipment) market will see considerable growth in 2018, driven by the development of smart vehicles in high-end market and the establishment of regulations in the U.S., the EU, Japan and China. The shipments of sensing camera in automotive OE market are expected to reach 121 million units in 2018, a year-on-year growth of 63% compared with 74 million units in 2017.“The soaring demand for sensing cameras is attributed to the development of autonomous driving”, says Yvette Lin, analyst of TrendForce. Driven by advancements in artificial intelligence, communication and sensing technology, many technology companies and traditional car makers have invested in the R&D of autonomous driving. Consumers also show increasing concerns for active safety, which push the demand for advanced driver assistance system (ADAS) and sensors.Currently, car makers adopt different ADAS sensing solutions, including millimeter-wave radar, ultrasonic radar and automotive camera, etc. Particularly, camera-based solutions are gradually accepted by car manufacturers since breakthroughs have been made in image recognition algorithms and capabilities of image processing chips. Camera-based solutions, which can detect the traffic around vehicles through image recognition, are now applied in both cars with ADAS and autonomous-driving vehicles in testing.According to Lin, current mass produced cars with ADAS carry an average of 4 to 8 cameras per car. After the launch of highly-autonomous vehicle in 2020, the number of cameras embedded in each car will increase to 10 to 12. In this trend, major camera manufacturers across the world have been actively deploying in the automotive market, including Chinese companies Sunny Optical and Sunex, Taiwan-based Asia Optical and Calin, and Korean manufactures Sekonix, who have been shipping products to the first-tier car makers.In addition to the development of smart vehicles in high-end market, the establishment of regulations for vehicle safety in the U.S., the EU, Japan and China also drives the rapid expansion of market. Since 2016, forward collision warning (FCW), lane maintenance system (LDW), automatic emergency braking system (AEB), and blind spot detection system (BSD) have been mandatory for vehicles or included in the New Car Evaluation Standard (NCAP) in areas like the United States, the European Union, and Japan. Particularly, China has for the first time included a number of evaluation criteria for active safety in the 2018 version of NCAP. As the largest market of cars in the world, China witnesses increasing demand for sensing camera, which will boost the global market for automotive sensing camera. TrendForce estimates that the shipments of automotive sensing camera will reach nearly 124 million units by 2020.
Key word:
Release time:2018-06-13 00:00 reading:1164 Continue reading>>
China's Top Smartphone Brands Staged Remarkable Performance, Driving the Total Production Volume of Smartphones up by 5.3% <span style='color:red'>YoY</span> in 1Q18
DRAMeXchange, a division of TrendForce, reports that the smartphone market has remained in the low season since 4Q17. Smartphone vendors did not start to stock up on components until the end of February 2018, when the end demand began to bounce back. Together with the remarkable performance of China's top smartphone brands, Huawei, Xiaomi, OPPO and Vivo, the global production volume of smartphone reached 340 million units in 1Q18, an increase of 5.3% over one year ago.Going forward to the second quarter, the global production volume of smartphone is expected to grow by 5% QoQ, as the top Chinese brands are expected to gain more because of distribution of flagship models and expansion in overseas market.Apple may lower the price of new flagships to expand market shareTrendForce notes that Samsung’s production volume of smartphone fell by nearly 9% in 1Q18 compared with one year ago. With the largest market share, Samsung faces price competition with fast-growing Chinese brands in end-markets. For 2Q18, Samsung is expected to produce 73 million smartphones, around the same as the number in 1Q18.Apple ranks the second in terms of production market share in 1Q18. Despite the lower-than-expected sales of iPhone 8, iPhone 8 plus and iPhone X, the company still produced 56 million smartphones in the first quarter due to price promotion of older models, a YoY growth of 7.5%. Going forward to the second quarter, the consumers tend to have a conservative attitude during the transitional period of two generations of flagship models. The total production for 2Q18 is estimated at about 41 million, the same as 2Q17.Apple will launch 3 flagships this year, increasing the memory content per box in the models and expanding the adoption of Face ID and full-screen. TrendForce believes that Apple is bound to re-think its pricing strategy this year, with possible adjustments in the prices in order to meet market expectations. TrendForce expects that the cost-effective model with LCD screen will be the best seller among the three flagships, helping the brand obtain greater market share.LG produced 13.5 million smartphones in 1Q18, over 50% of which were shipped to North America, its largest market. Entry- and mid-level phones contributed to the majority of LG’s sales. Sony has adopted different product strategy in recent years, with a focus on mid to high-end models which have higher profit margins. However, the existing market of Sony has been shrinking due to the high performance-price ratio of Chinese brands. As the result, Sony produced only about 2.2 million smartphones in the first quarter. In the second quarter, its production volume may increase slightly driven by its new Xperia XZ2.Nokia has constant growth of smartphone production volume over the past quarters after building partnership with FIH Mobile. Nokia not only benefited from the bargaining power of FIH Mobile, but also made use of the long-established reputation and distribution channels of its own. However, the smartphone market has seen increasing competitors and cost pressure, squeezing the room for small and medium-sized brands. Therefore, Nokia will first secure its position in the market before seeking profit, with the aim to strive for a place in the top 10 smartphone vendors across the world. For the first quarter, Nokia's total production volume is about 4.3 million, and is estimated to grow by 16% in 2Q18.Xiaomi has a chance to surpass OPPO and ranks the fourthHuawei still tops the Chinese brands, with the third highest production volume worldwide, following Samsung and Apple. Although Huawei’s expansion in overseas markets has met some setbacks in North America, its Glory models have successfully presented the brand in the European market. In the next, Huawei will copy the strategy to the Indian market with the cost-effective Glory series. According to TrendForce’s forecast, Huawei’s production volume increased by 10% YoY in 1Q18, and may have a chance to grow by 8% QoQ in the second quarter due to the sales of flagship models.Xiaomi registered 27 million units in smartphone production for 1Q18. It also recorded remarkable shipments in India market, surpassing Samsung and taking the highest market share in India. For 2018, Xiaomi will maintain the strategy of low-margin. Meanwhile, the company aims to expand its customer base by promoting other smart devices, software, and AI applications in Xiaomi Ecosystem. The growth in production volume may allow Xiaomi to compete with OPPO for the fourth place in the global production market share ranking.OPPO and Vivo, who are faced with high inventory levels due to low demand in 4Q17, had to cut down their production plans significantly to adjust the inventory levels. As the stock-up demand recovered, the total production volume of the two brands grew by 10% and 2% QoQ respectively in 1Q18. Driven by the release of flagship, the production volume of OPPO and Vivo will return to the average level of last year, reaching 33 million units and 29 million units respectively in 2Q18.In terms of marketing strategy, OPPO and Vivo have changed previous strategy of dense and widespread channel vendors and retailers. In addition to reducing the number of retailers, the two brands also put more effort in running e-commerce platforms, with the aim to reduce the costs of distribution channel operation and management, thus boosting profits.In addition, Vivo also turns to advertising. The company has signed an agreement with the International Football Federation (FIFA) to provide sponsorship for the World Cup for six years, including the one to commence in Russia this June, but it still needs further observation to tell whether the company’s advertising strategy will work.
Key word:
Release time:2018-06-01 00:00 reading:1227 Continue reading>>

Turn to

/ 1

  • Week of hot material
  • Material in short supply seckilling
model brand Quote
RB751G-40T2R ROHM Semiconductor
CDZVT2R20B ROHM Semiconductor
BD71847AMWV-E2 ROHM Semiconductor
TL431ACLPR Texas Instruments
MC33074DR2G onsemi
model brand To snap up
ESR03EZPJ151 ROHM Semiconductor
BP3621 ROHM Semiconductor
TPS63050YFFR Texas Instruments
IPZ40N04S5L4R8ATMA1 Infineon Technologies
STM32F429IGT6 STMicroelectronics
BU33JA2MNVX-CTL ROHM Semiconductor
Hot labels
ROHM
IC
Averlogic
Intel
Samsung
IoT
AI
Sensor
Chip
About us

Qr code of ameya360 official account

Identify TWO-DIMENSIONAL code, you can pay attention to

AMEYA360 mall (www.ameya360.com) was launched in 2011. Now there are more than 3,500 high-quality suppliers, including 6 million product model data, and more than 1 million component stocks for purchase. Products cover MCU+ memory + power chip +IGBT+MOS tube + op amp + RF Bluetooth + sensor + resistor capacitance inductor + connector and other fields. main business of platform covers spot sales of electronic components, BOM distribution and product supporting materials, providing one-stop purchasing and sales services for our customers.

Please enter the verification code in the image below:

verification code